ECG interpretation
- RATE
- Rate calculation
- Six-second method: # R-R intervals x10
- Rate calculation
- RHYTHM
- Check:
- bottom rhythm strip for regularity
- i.e. regular, regularly irregular, and irregularly irregular.
- P wave before each QRS, QRS after each P
- PR interval (for AV blocks)
- QRS (for bundle branch blocks)
- prolonged QT
- bottom rhythm strip for regularity
- Recognize “patterns” such as
- f. atrial fibrillation, PVC’s
- g. PAC’s, escape beats
- h. ventricular tachycardia
- i. paroxysmal atrial tachycardia
- j. AV blocks
- k. bundle branch blocks
4. AXIS
| Lead I | Lead aVF | differential | |
| Normal axis (0 to +90 degrees) | |||
| Positive | Positive |  | |
| Left axis deviation (-30 to -90) | |||
| Positive Also check lead II. To be true left axis deviation, it should also be down in lead II | Negative | LVH left anterior fasicular block inferior wall MI note: Bifascicular block = RBBB + LAFB |  |
| Right axis deviation (+90 to +180) | |||
| Negative | Positive | RVH left posterior fascicular block lateral wall MI. |  |
| Indeterminate axis (-90 to -180) | |||
| Negative | Negative | ||
- HYPERTROPHY
- LVH — left ventricular hypertrophy
- S wave in V1 or V2 + R wave in V5 or V6 > 35mm
- aVL R wave > 12mm.
- RVH — right ventricular hypertrophy
- R wave > S wave in V1 and gets progressively smaller to left V1-V6 (normally, R wave increases from V1-V6).
- Atrial hypertrophy (leads II and V1)
- Right atrial hypertrophy
- Peaked P wave in lead II > 2.5 mm in amplitude
- V1 has increase in the initial positive direction
- Left atrial hypertrophy
- Notched wide (> 3mm) P wave in II
- V1 has increase in the terminal negative direction.
- Right atrial hypertrophy
- LVH — left ventricular hypertrophy
- INFARCT
| Ischemia | Represented by symmetrical T wave inversion (upside down) Look in leads I, II, V2-V6. |
| Injury | Acute damage — look for elevated ST segments. |
| Infarct | “Pathologic” Q waves. To be significant, a Q wave must be at least one small square wide or one-third the entire QRS height. |
- Certain leads represent certain areas of the left ventricle:
| V1-V2 | anteroseptal wall | II, III, aVF | inferior wall |
| V3-V4 | anterior wall | I, aVL | lateral wall |
| V5-V6 | anterolateral wall | V1-V2 | posterior wall (reciprocal) |
Imposters: ECG Causes of ST segment elevation: ELEVATION
Electrolyte abnormalities
Left bundle branch block
Aneurysm of left ventricle
Ventricular hypertrophy
Arrhythmia disease (Brugada syndrome, ventricular tachycardia)
Takotsubo/Treatment (iatrogenic pericarditis)
Injury (myocardial infarction or cardiac contusion)
Osborne waves (hypothermia or hypocalcemia)
Non-atherosclerotic (vasospasm or Prinzmetal’s angina)
Pericarditis:
- ECG: Usually diffuse ST elevation, Can be associated with PR depression (elevation in aVR), No reciprocal changes, The morphology of the ST segment

Acute Myocarditis
- Myocarditis can occur alone or in combination with pericarditis
- Can cause similar ST changes to pericarditis
- Focal myocarditis can cause regional ST elevation even with ST depression and can be difficult to distinguish from a STEMI
Early Repolarization
- A usually benign ECG pattern with an incidence of 5 to 13% of people so very common especially in young healthy athletes
- ST elevation (J point elevation) of 1 mm or more in 2 or more contiguous leads (usually inferior or lateral or both)
- ST morphology similar to pericarditis
- No reciprocal changes

PE ECG changes:
- Sinus tachycardia – the most common abnormality; seen in 44% of patients.
- Complete or incomplete RBBB
- Right ventricular strain pattern – T wave inversions in the right precordial leads (V1-4) ± the inferior leads (II, III, aVF). This pattern is seen in up to 34% of patients and is associated with high pulmonary artery pressures.
- Right axis deviation
- SI QIII TIII pattern – deep S wave in lead I, Q wave in III, inverted T wave in III. This “classic” finding is neither sensitive nor specific for pulmonary embolism; found in only 20% of patients with PE.

ACS is rarely associated with tachycardia
Both ACS and PE will present with elevated troponin
Ultrasonography may be useful in differentiating the two
AF ECG Changes
- Irregularly irregular rhythm.
- No P waves.
- Absence of an isoelectric baseline.
- Variable ventricular rate.
- QRS complexes usually < 120 ms unless pre-existing bundle branch block, accessory pathway, or rate related aberrant conduction.
- Fibrillatory waves may be present and can be either fine (amplitude < 0.5mm) or coarse (amplitude >0.5mm).
- Fibrillatory waves may mimic P waves leading to misdiagnosis.

Atrial Flutter ECG Changes:
- Narrow complex tachycardia
- Regular atrial activity at ~300 bpm
- Flutter waves (“saw-tooth” pattern) best seen in leads II, III, aVF — may be more easily spotted by turning the ECG upside down!
- Flutter waves in V1 may resemble P waves
- Loss of the isoelectric baseline
- Fixed AV blocks
- Ventricular rate is a fraction of the atrial rate, e.g.
- 2:1 block = 150 bpm
- 3:1 block = 100 bpm
- 4:1 block = 75 bpm
- Variable AV block
- The ventricular response is irregular and may mimic AF
- On closer inspection, there may be a pattern of alternating 2:1, 3:1 and 4:1 conduction ratios


Important ECG Patterns
| Hyperkalaemia | Bradycardia / AV blockHR 30Flattend P wavePeaked T wavesSine wave |   |
| HypoKalemia (also Barycardia, HypocalcaemiaHypomagnesaemiaHypothermia) | Prominent U waves(if >1-2mm or 25% of the height of the T wave) |  |
| Sodium Channel Blockade tricyclic antidepressant | Broad complex, QRS > 100ms positive R’ wave in aVR(+ tachycardia) |   |
| Digoxin Toxicity | Atrial tachycardia high grade AV block Frequent Ventricular Ectopic Beats(VEB) Rx: Digiband |   |
| Digoxin effect | Downsloping ST depression with a characteristic “Salvador Dali sagging” appearanceFlattened, inverted, or biphasic T waves.Shortened QT interval. |  |
| Pericardial Effusion | Low voltage Electrical alternans+Sinus tachy |  |
| Pericarditis | Widespread concave ST elevation and PR depression throughout | 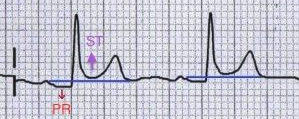 |
| Raised ICP Due to SAH Intraparenchymal haemorrhage | Cerebral T wavesGiant inverted T waves widespread Long QT DDx – Wellens |  |
| Brugada Syndrome | Coved STE in V1-3 |  |
| Arrhythmogenic Right Ventricular Cardiomyopathy | Epsilon waves Signs of RVH  |  |
| hypothermia | positive deflection at the J point (negative in aVR and V1) |  |
| Long QT |  | |
| Wellens (critical stenosis of the LAD) | Biphasic T Waves in V2,V3 (Type A) Deeply Inverted T Waves in V2,V3 (Type B) |   |
| De Winter’s T Waves (anterior STEMI equivalent that presents without obvious ST segment elevation) | ST depression and peaked T waves in the chest leads |  |
| Delta Wave | A slurred upstroke to the QRS complex Short PR interval (< 120ms)Broad QRS (> 100ms) |  |
| Not a pacemaker! ☺ |  | |
